

Department of Computer Applications | Roorkee College of Smart Computing
How BCA, MCA, and Data Science students can harness verified Government of India datasets (Census, NSSO/PLFS, data.gov.in & AI Kosh) for portfolio-defining capstone projects.
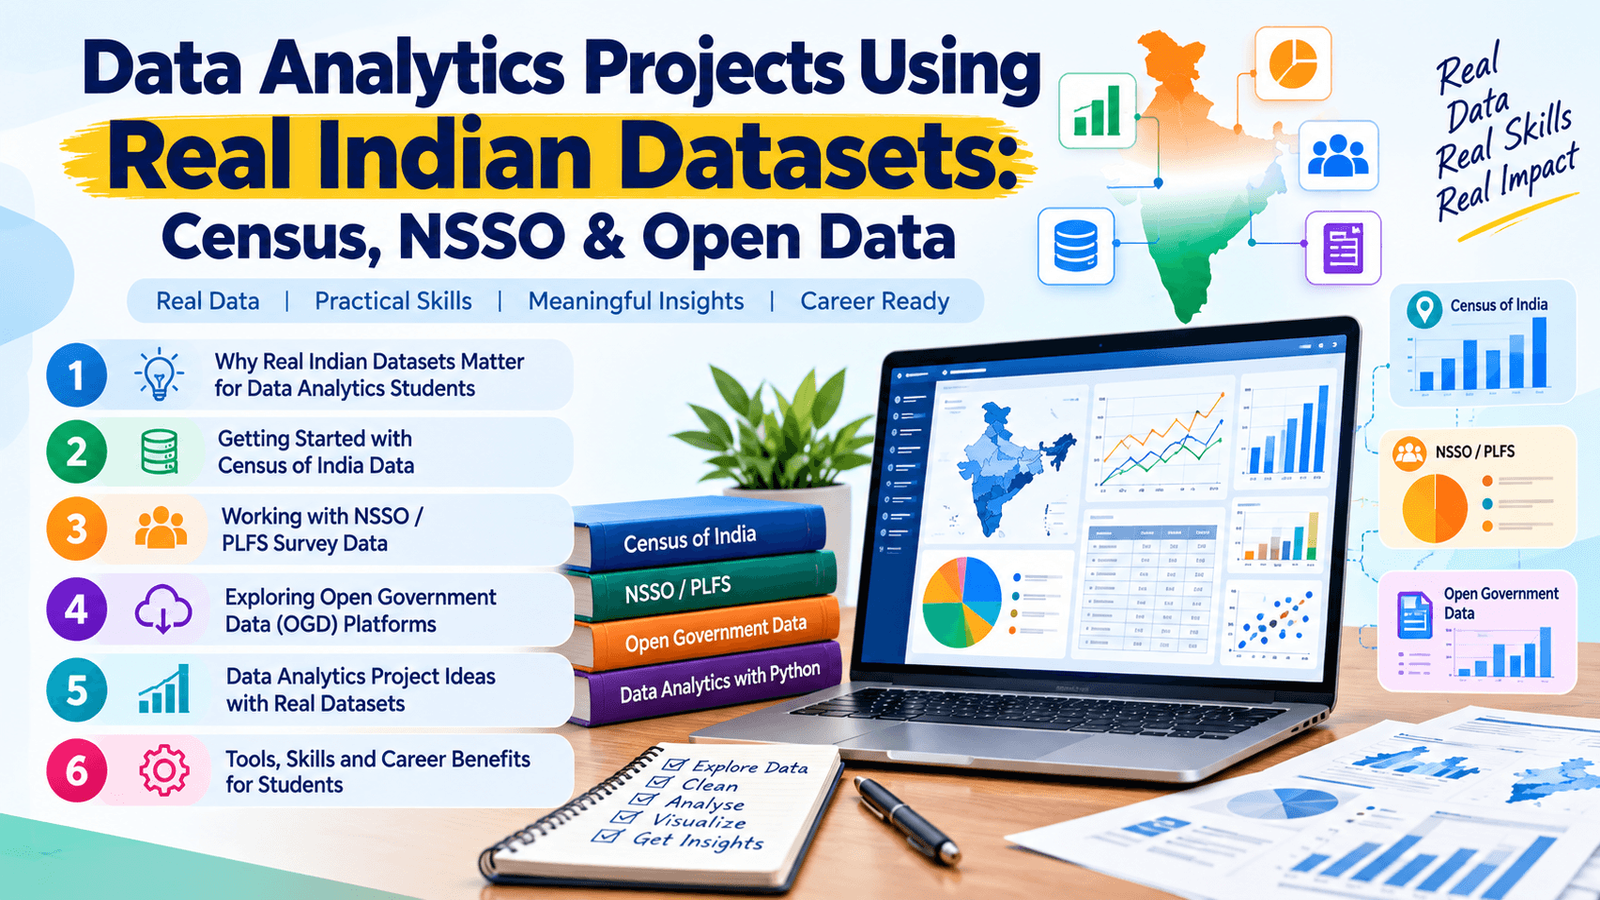
Data Analytics Projects Using Real Indian Datasets: Census, NSSO & Open Data give students a practical and authoritative pathway to move from classroom theory to job-ready skill building. Instead of relying on synthetic spreadsheets or overused demo files, learners can pull real numbers published by the Government of India — population figures from the Census, employment trends from the National Sample Survey Office (NSSO), and thousands of open tables from the Open Government Data (OGD) platform — and turn them into portfolio-ready analytics work.
This guide walks through where to locate these datasets, how to architect a reproducible project around them, and why this verified approach matters for BCA, MCA, and Data Science students preparing for analytics careers at Haridwar University.
Table of Contents
- Why Real Government Datasets Matter for Data Analytics Students
- Getting Started with Census of India Data
- Working with NSSO / PLFS Survey Data
- The Open Government Data (OGD) Platform and AI Kosh
- Step-by-Step: Building Your First Analytics Project
- Building a Career-Ready Portfolio as an HU Student
- Frequently Asked Questions (9 Practical FAQs)
1. Why Real Government Datasets Matter for Data Analytics Students
Most beginner data analytics tutorials rely on the exact same handful of toy datasets — the Iris flower set, the Titanic passenger manifest, or an artificial stock-price sample. While these datasets are helpful for memorizing basic Python or SQL syntax, they rarely teach the messy, ambiguous judgment calls that technical recruiters and hiring managers actually look for: handling missing records, reconciling inconsistent administrative boundaries, resolving conflicting unit measurements, and understanding domain context before generating a chart.
Government-published public datasets bridge this critical educational gap. They are substantial in volume, occasionally imperfect, thoroughly documented with official metadata dictionaries, and freely licensed for academic, research, and non-commercial exploration.
⚠️ The Toy Dataset Trap
Toy datasets are pre-cleaned, artificially balanced, and have been solved thousands of times online. Recruiters skim past them because they cannot evaluate your ability to handle real data challenges.
✓ The Verified Government Advantage
Official datasets from Census, MoSPI, and data.gov.in carry immediate provenance. Interviewers can verify your sources in seconds, demonstrating genuine analytical inquiry and rigorous data governance.
2. Getting Started with Census of India Data
The Census of India portal, maintained by the Office of the Registrar General & Census Commissioner, Ministry of Home Affairs, serves as the country’s definitive demographic foundation. It catalogues population, literacy, household amenities, worker classifications, and migration tables across national, state, district, sub-district, and village tiers.
While the 2011 Census remains the most recent complete published census count, Census 2027 — India’s first fully digital census — is officially underway. Houselisting operations ran from April to September 2026, and full population enumeration is scheduled for February 2027 (conducted in September 2026 in snow-bound regions, including parts of Uttarakhand). Until those results are compiled and published, the 2011 census figures and updated annual projections provide the benchmark for student projects.
Primary Data Sources & Project Archetypes
For university capstones, the two most accessible entry points are the Primary Census Abstract (PCA) tables and the District Census Handbooks (DCHB), both downloadable directly in CSV or Excel formats:
- Uttarakhand District-Wise Literacy & Sex-Ratio Dashboard: Compare male vs. female literacy across Dehradun, Haridwar, Nainital, and hill districts using choropleth maps.
- Urban vs. Rural Household Amenities Matrix: Analyze access to treated drinking water, electricity, and clean cooking fuel across administrative subdivisions.
- Workforce Participation & Marginal Workers Study: Examine agricultural cultivators versus industrial and service workers across regional clusters.
3. Working with NSSO / PLFS Survey Data
The National Sample Survey Office (NSSO), operating within the National Statistical Office under the Ministry of Statistics and Programme Implementation (MoSPI), conducts India’s large-scale representative household surveys.
Its primary flagship survey is the Periodic Labour Force Survey (PLFS). Released quarterly for urban areas and annually for rural and urban aggregates, the PLFS details key economic health indicators:
- Labour Force Participation Rate (LFPR): Percentage of population engaged in or available for economic activities.
- Worker Population Ratio (WPR): Proportion of employed persons across demographic age brackets.
- Unemployment Rate (UR): Disaggregated by educational attainment, gender, and state geography.
Because PLFS reports are published on a structured quarterly schedule, they teach an invaluable skill that static toy datasets omit: working with genuine time-series indicators. Students learn how to normalize multi-period releases, adjust for seasonal variations, and track directional changes in economic indicators over time.
4. The Open Government Data (OGD) Platform and AI Kosh
The Open Government Data (OGD) Platform (data.gov.in), developed by the National Informatics Centre (NIC) under the National Data Sharing and Accessibility Policy (NDSAP), aggregates thousands of datasets spanning central ministries, state departments, and public enterprises. Topics range from agricultural crop yields and river water quality to transportation statistics and national highway tolls.
🚀 AI Kosh (India AI Mission)
Curated under the India AI Mission (aikosh.indiaai.gov.in), AI Kosh packages public datasets specifically formatted for machine learning models, complete with structured data cards and standardized metadata.
📊 RBI Database on Indian Economy (DBIE)
For finance- and economics-focused projects, the Reserve Bank of India’s statistical warehouse offers authoritative time series on banking credit, inflation metrics, foreign reserves, and monetary velocity.
5. Step-by-Step: Building Your First Analytics Project
Whether examining Census demographics or PLFS quarterly employment records, the Department of Computer Applications at Haridwar University trains students to follow a rigorous, industry-grade analytical lifecycle:
- Formulate a Precise Hypothesis: Avoid overly broad queries like “Analyze Indian demographics”. Instead, define narrow, quantifiable questions: “How has female labour force participation in urban Uttarakhand changed between 2021 and 2025 across age cohorts?”
- Acquire Official Raw Exports: Download authoritative CSV, XLSX, or microdata files directly from official portals. Never copy-paste numbers from third-party blogs. Record the exact source URL, retrieval date, and table identifier in your project documentation.
- Perform Data Cleaning & Harmonization: Handle null records, verify district spelling variations (e.g., Haridwar vs. Hardwar), check unit measurements (thousands vs. absolute numbers), and remove redundant subtotal rows using Python libraries like Pandas and NumPy.
- Exploratory Data Analysis (EDA) & Visualization: Use Excel pivot tables or Microsoft Power BI for initial pattern discovery. Transition into Python (Matplotlib, Seaborn, Plotly) or R for reproducible, code-driven visual analysis and interactive choropleth maps.
- Deliver Insights, Not Just Visuals: Every visualization must be accompanied by 2-3 written analytical sentences explaining the underlying trend, outlier anomalies, or socioeconomic drivers. Charts without business interpretation do not impress interviewers.
- Document Code & Citations: Maintain a version-controlled GitHub repository with a detailed README citing the government publisher, data dictionary, preprocessing steps, and key findings.
6. Building a Career-Ready Portfolio as an HU Student
At the Roorkee College of Smart Computing, BCA and MCA students in the Department of Computer Applications receive comprehensive, faculty-mentored exposure to database architecture, business intelligence tools, and data engineering fundamentals.
Through mandatory live projects and practical sessions in our high-performance computing laboratories, students acquire the technical stamina required to convert raw administrative numbers into deployment-grade web dashboards and research dissertations. Review our dedicated career blueprints on career paths after BCA and career options after MCA for industry insights.
Transparent Program Tuition & Merit Scholarships
Haridwar University maintains clear and affordable tuition structures for its professional computing degrees:
- BCA (Smart Computing): Approximately ₹82,000 for Year 1, and ₹65,000 per year for Years 2 and 3.
- MCA (with Applied AI & Analytics): Approximately ₹92,000 for Year 1, and ₹75,000 for Year 2.
- Merit Scholarship Slabs: Concessions ranging from 10% up to 80% on first-year tuition based on Class 12 aggregate, CUET percentile, or JEE scores.
Complete fee slabs, hostel amenities, and domicile waivers are detailed on the Admissions & Fees page, and step-by-step registration guidance is on the Admission Overview page. Students can also consult our dedicated Student Welfare Service for personalized counseling and assistance.
Beyond curriculum coursework, Haridwar University’s Training & Placement Cell actively partners with top IT services, consulting, and analytics employers. A portfolio anchored by verifiable, real-world Indian datasets — rather than generic tutorial projects — provides concrete proof of capability that stands out during campus placement interviews.
Build Your Future in Applied Analytics & Computing
Master real-world data analytics with expert faculty mentorship, modern computing laboratories, and comprehensive placement support at Haridwar University.
7. Frequently Asked Questions (9 Practical FAQs)
1. What are the best free Indian datasets for a beginner data analytics project?
The Census of India (censusindia.gov.in), NSSO / PLFS reports via MoSPI (mospi.gov.in), and the Open Government Data Platform (data.gov.in) are the three most reliable and authoritative free starting points, each offering thoroughly documented, downloadable datasets.
2. How do I download Census of India data for a project?
Visit censusindia.gov.in, navigate to the data catalogue, search by specific table type (such as the Primary Census Abstract or District Census Handbook), filter by state or district, and download the raw CSV or Excel tables rather than manually copying numbers.
3. What is NSSO / PLFS data and how is it useful for analytics students?
The Periodic Labour Force Survey (PLFS) is the central government’s quarterly and annual employment survey, administered by MoSPI. It is ideally suited for student projects examining unemployment rates, labour force participation, and gender employment disparities, providing invaluable exposure to genuine multi-period time-series analysis.
4. Which tools should I use to analyze Census or NSSO data — Excel, Python, or Power BI?
Begin with Microsoft Excel or Power BI for rapid exploratory data profiling, summary aggregations, and dashboard charts. Transition to Python (utilizing pandas, matplotlib, and seaborn) or R once your project requires automated, reproducible cleaning pipelines, complex statistical modeling, or spatial map overlays.
5. Can I use data.gov.in datasets for my final year project?
Yes. Datasets hosted on data.gov.in are explicitly published for research, educational, and non-commercial utilization under the National Data Sharing and Accessibility Policy (NDSAP), making them perfectly suited for final-year BCA, MCA, and B.Tech projects with standard academic citations.
6. Is prior knowledge of statistics required to work with government datasets?
Basic statistical literacy is helpful but not an absolute prerequisite to begin. Fundamental measures — such as mean, median, percentages, ratios, and linear trend comparisons — are sufficient to build an insightful introductory dashboard. Advanced statistical inference and hypothesis testing can be incorporated as your degree advances.
7. What kind of data analytics projects can BCA students build in their final year?
Realistic, high-impact BCA capstones include district-level literacy or sex-ratio dashboards using Census tables, state-wise youth employment trend comparisons from PLFS surveys, or sector-wise public infrastructure expenditure tracking from data.gov.in — each paired with interactive Power BI or Streamlit dashboards.
8. How is data analytics different from data science for a beginner?
Data analytics centers on examining historical and current data to answer specific operational questions, uncover actionable trends, and build communicative visual dashboards. Data science broadens this scope into predictive modeling, algorithmic machine learning, and deep learning. Applied analytics is universally regarded as the essential prerequisite foundation before diving into machine learning.
9. How can a data analytics portfolio help in campus placements?
A portfolio anchored by verifiable public government datasets — characterized by clearly formulated research questions, transparent data cleaning code, and honest socioeconomic interpretation — provides recruiters with unambiguous, verifiable proof of your applied analytical competence.